目录
1 天气数据集爬取
2 数据可视化
3 模型预测数据
3.1 单变量线性回归
模型一:单变量线性回归模型
3.2 多变量线性回归
模型二:基于LinearRegression实现的多变量线性回归模型
模型三:基于成本函数和梯度下降实现的多变量线性回归模型
3.3 以"线性回归"的方式来拟合高阶曲线
模型四:一阶线性拟合
模型五:二阶曲线拟合
模型六:三阶曲线拟合
3.4 线性回归预测天气
模型七:线性回归预测模型
3.5 线性回归的其它计算方法
模型八:基于协方差-方差公式实现的线性回归模型
模型九:基于成本函数和批量梯度下降算法实现的线性回归模型
模型十:基于SGDRegressor随机梯度下降算法的实现
3.6 对数几率回归
模型十一:使用LogisticRegression进行逻辑回归模型
模型十二:基于成本函数和梯度下降算法进行逻辑回归模型
模型十三:基于scipy.optimize优化运算库实现对数几率回归模型
4 总结
5 声明
1 天气数据集爬取
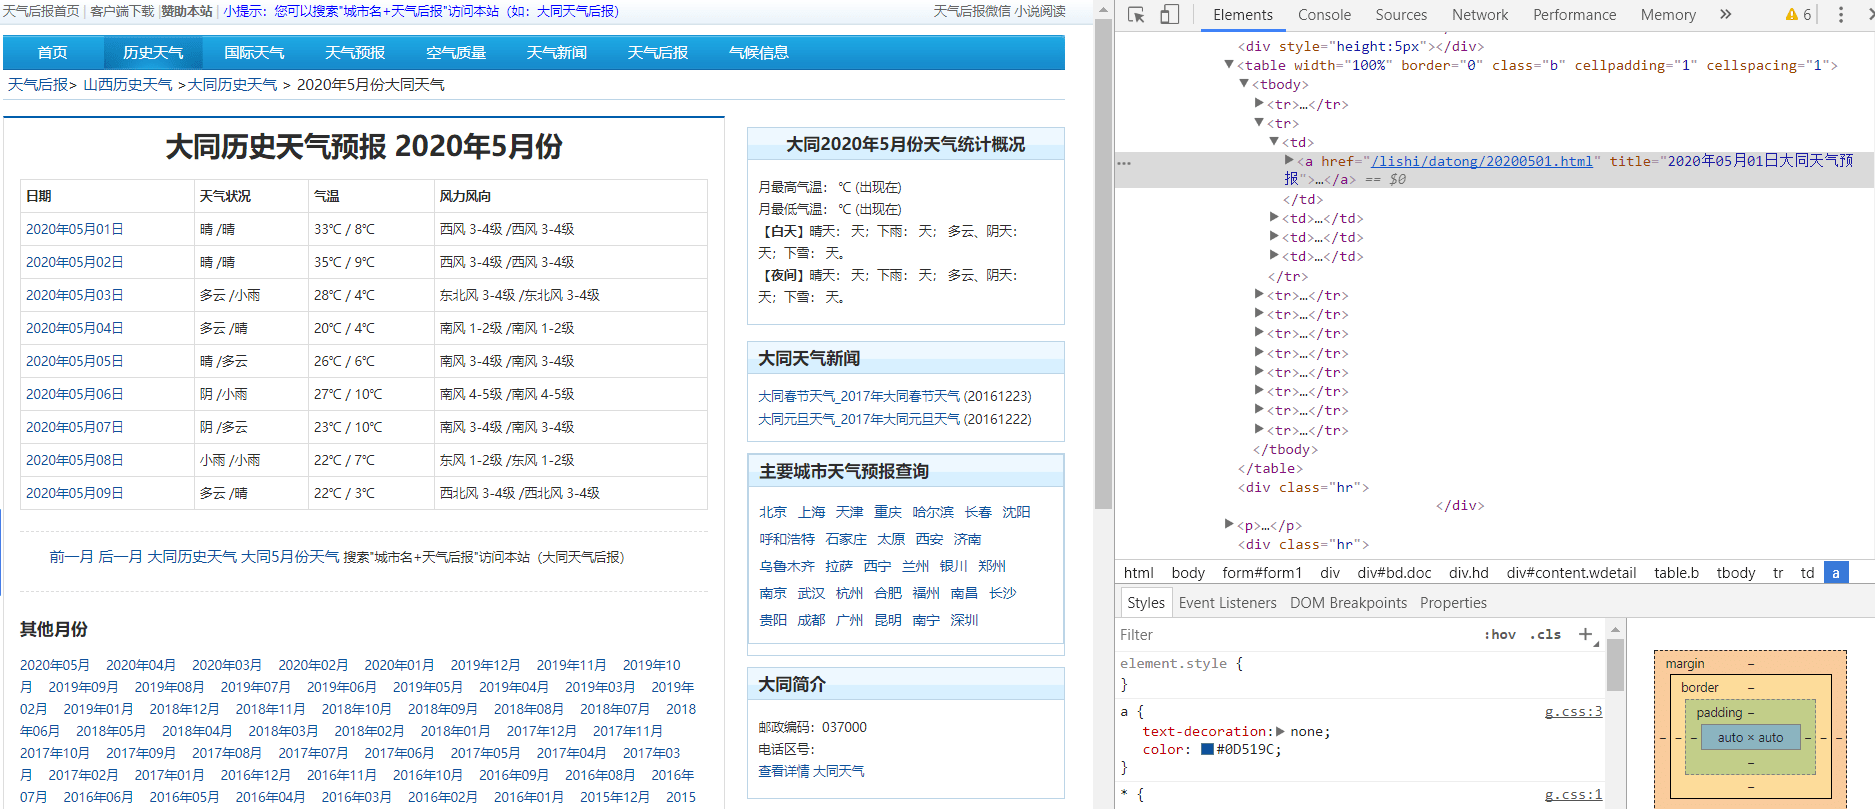
爬取思路:确定目标(目标网站:大同历史天气预报 2020年5月份)
请求网页(第三方库 requests)
解析网页(数据提取)
保存数据(这里以 .csv 格式存储到本地)
因为之前作过爬虫方面的文章,且本文重点放在数据可视化及预测上,故具体爬虫思路不在这里一一赘述。
读者可参考下方代码中的注释进一步理解,亦可参考我发表过的文章,这里给出链接:
①Python爬虫:10行代码真正实现“可见即可爬”
②正则表达式心中有,还愁爬虫之路不好走?
import requests from bs4 import BeautifulSoup import pandas as pd
def get_data(url): # 请求网页(第三方 requests) resp = requests.get(url) # 对于获取到的 HTML 二进制文件进行 'gbk' 转码成字符串文件 html = resp.content.decode('gbk') # 通过第三方库 BeautifulSoup 缩小查找范围(同样作用的包库还有re模块、xpath等) soup = BeautifulSoup(html,'html.parser') # 获取 HTML 中所有<tr>…</tr>标签,因为我们需要的数据全部在此标签中存放 tr_list = soup.find_all('tr') # 初始化日期dates、气候contains、温度temp值 dates,contains,temp = [],[],[] for data in tr_list[1:]: # 不要表头 # 数据值拆分,方便进一步处理(这里可以将获得的列表输出[已注释],不理解的读者可运行查看) sub_data = data.text.split() # print(sub_data) # 观察上一步获得的列表,这里只想要获得列表中第二个和第三个值,采用切片法获取 dates.append(sub_data[0]) contains.append(','.join(sub_data[1:3])) # print(contains) # 同理采用切片方式获取列表中的最高、最低气温 temp.append(','.join(sub_data[3:6])) # print(temp) # 使用 _data 表存放日期、天气状况、气温表头及其值 _data = pd.DataFrame() # 分别将对应值传入 _data 表中 _data['日期'] = dates _data['天气状况'] = contains _data['气温'] = temp return _data
# 爬取目标网页(大同市2020年5月份天气[网站:天气后报]) data_5_month = get_data('http://www.tianqihoubao.com/lishi/datong/month/202005.html')
# 拼接所有表并重新设置行索引(若不进行此步操作,可能或出现多个标签相同的值) data = pd.concat([data_5_month]).reset_index(drop = True)
# 将 _data 表以 .csv 格式存入指定文件夹中,并设置转码格式防止乱花(注:此转码格式可与 HTML 二进制转字符串的转码格式不同) data.to_csv('F:/DaTong5Mouth.csv',encoding='utf-8')

2 数据可视化
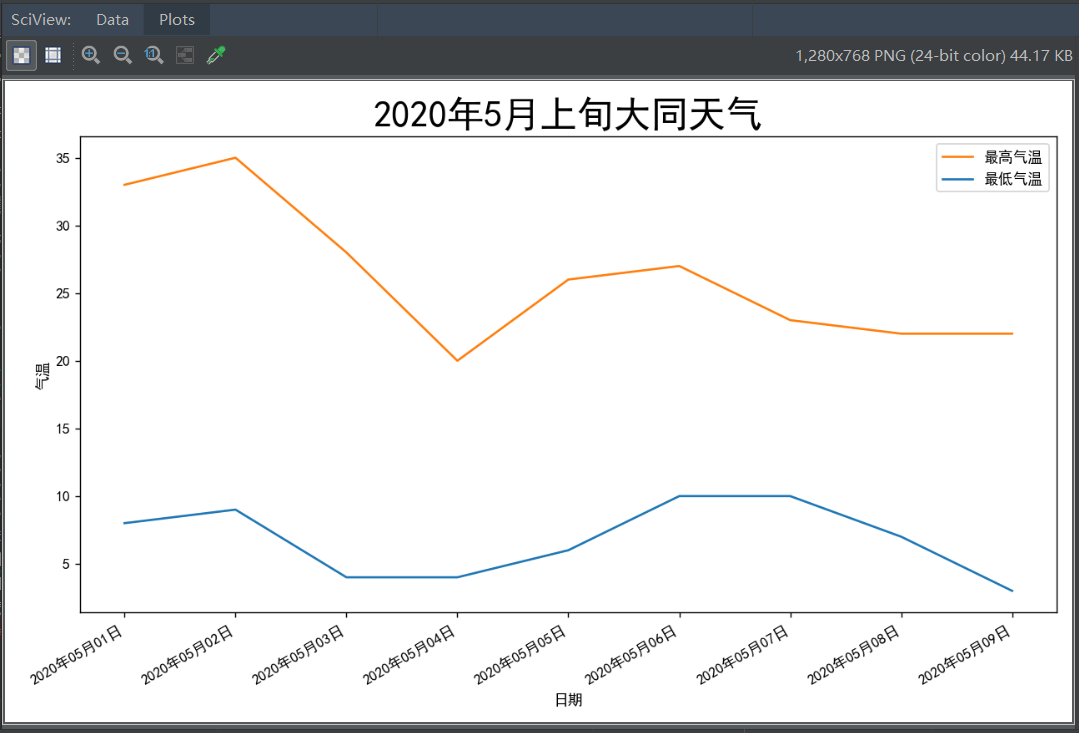
数据可视化用到了可视化工具
其要点包含有:读取数据、数据清洗、数据处理、可视化工具的使用。
# 数据可视化 from matplotlib import pyplot as plt import pandas as pd # 解决显示中文问题 plt.rcParams['font.sans-serif'] = ['SimHei'] # 第一步:数据读取 data = pd.read_csv('/home/zzr/DaTong5Mouth.csv') # 第二步:数据处理(由于我们知道文本内容,不存在脏数据,故忽略数据清理步骤) data['最高气温'] = data['气温'].str.split('/',expand=True)[0] data['最低气温'] = data['气温'].str.split('/,',expand=True)[1] data['最高气温'] = data['最高气温'].map(lambda x:x.replace('℃,','')) data['最低气温'] = data['最低气温'].map(lambda x:x.replace('℃',''))
dates = data['日期'] highs = data['最高气温'] lows = data['最低气温']
highs_float=[] for num1 in highs: highs_float.append(float(num1)) lows_float=[] for num2 in lows: lows_float.append(float(num2))
# 画图(折线图) # 设置画布大小及比例 fig = plt.figure(dpi=128,figsize=(10,6))
# 设置最高温最低温线条颜色及宽度等信息 L1,=plt.plot(dates,lows_float,label='最低气温') L2,=plt.plot(dates,highs_float,label='最高气温') plt.legend(handles=[L1,L2],labels=['最高气温','最低气温'], loc='best')# 添加图例
# 图表格式 # 设置图形格式 plt.title('2020年5月上旬大同天气',fontsize=25) # 字体大小设置为25 plt.xlabel('日期',fontsize=10) # x轴显示“日期”,字体大小设置为10 fig.autofmt_xdate() # 绘制斜的日期标签,避免重叠 plt.ylabel('气温',fontsize=10) # y轴显示“气温”,字体大小设置为10 plt.tick_params(axis='both',which='both',labelsize=10)
# plt.plot(highs,lows,label = '最高气温') # 修改刻度 plt.xticks(dates[::1]) # 由于数据不多,将每天的数据全部显示出来
# 显示折线图 plt.show()
3 模型预测数据
3.1 单变量线性回归
模型一:单变量线性回归模型
import numpy as np import pandas as pd import matplotlib.pyplot as plt # 解决中文问题(若没有此步骤,表名字及横纵坐标中的汉语将无法显示[具体会显示矩形小方格]) plt.rcParams['font.sans-serif'] = ['SimHei']
# 将数据从上一步存入的 .csv 格式文件中读取 data = pd.read_csv(r'F:\DaTong5Mouth.csv') # 由于最高气温与最低气温中有 / 分隔,故将其分开,即“气温”列由一列变为两列——“最高气温”和“最低气温” data['最高气温'] = data['气温'].str.split('/',expand=True)[0] # 我们要对数值进行分析,所以将多余的单位 ℃ 从列表中去掉,只保留数值部分 data['最高气温'] = data['最高气温'].map(lambda x:x.replace('℃,','')) # 日次操作同理,这里不再赘述 data['日期'] = data['日期'].map(lambda x:x.replace('2020年05月0','')) data['日期'] = data['日期'].map(lambda x:x.replace('日','')) # 不理解的小伙伴可运行下两行代码查看运行结果(这里先注释掉了) # print(data['日期']) # print(data['最高气温'])
def initPlot(): # 先准备好一块画布 plt.figure() # 生成图表的名字 plt.title('2020年5月上旬大同天气') # 横坐标名字 plt.xlabel('日期') # 纵坐标名字 plt.ylabel('当日最高气温') # 表内有栅格(不想要栅格把此行注释掉即可) plt.grid(True) return plt
plt = initPlot() # 画图 # 传入对应日期及其最高气温参数 xTrain = np.array([1,2,3,4,5,6,7,8,9]) yTrain = np.array([33,35,28,20,26,27,23,22,22]) # k是黑色,.是以点作为图上显示 plt.plot(xTrain, yTrain, 'k.') # 将图显示出来 plt.show()
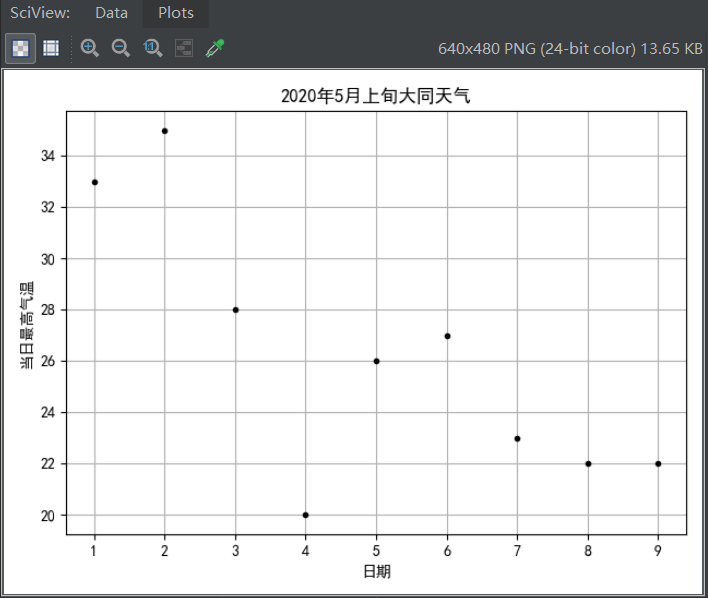
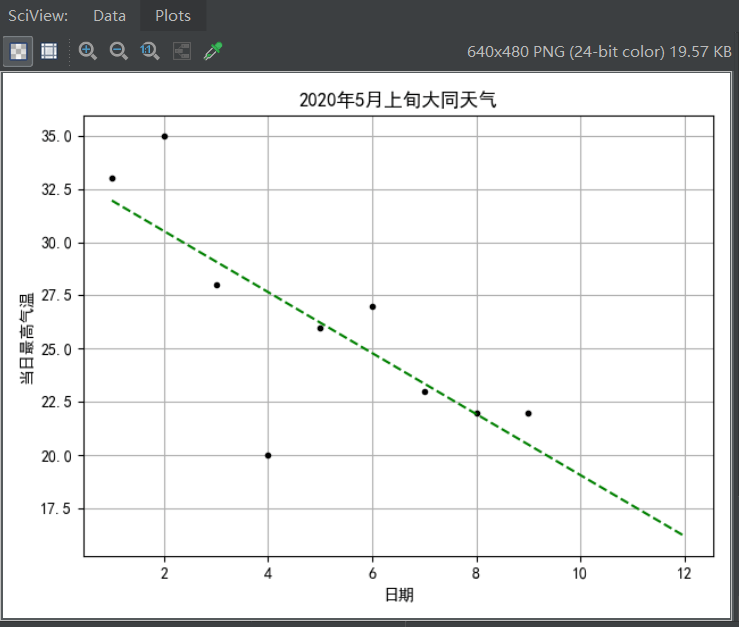
可以看到:
- 最高气温随着日期的变化,大致呈现线性变化(最近气温下降);
- 如果根据现有的训练数据能够拟合出一条直线,使之与这些训练数据的各点都比较接近,那么根据该直线,就可以计算出在10号或者11号的温度情况(气温受到影响因素较多,故这里仅预测为数不多的数据)
解决方案:
- 采用Python scikit-learn库中提供的sklearn.linear_model.LinearRegression对象来进行线性拟合。
- 根据判别函数,绘制拟合直线,并同时显示训练数据点。
- 拟合的直线较好的穿过训练数据,根据新拟合的直线,可以方便的求出最近日期下对应的最高气温(预测结果)。
import numpy as np import pandas as pd import matplotlib.pyplot as plt from sklearn.linear_model import LinearRegression # 解决中文问题(若没有此步骤,表名字及横纵坐标中的汉语将无法显示[具体会显示矩形小方格]) plt.rcParams['font.sans-serif'] = ['SimHei']
# 将数据从上一步存入的 .csv 格式文件中读取 data = pd.read_csv(r'F:\DaTong5Mouth.csv') # 由于最高气温与最低气温中有 / 分隔,故将其分开,即“气温”列由一列变为两列——“最高气温”和“最低气温” data['最高气温'] = data['气温'].str.split('/',expand=True)[0] # 我们要对数值进行分析,所以将多余的单位 ℃ 从列表中去掉,只保留数值部分 data['最高气温'] = data['最高气温'].map(lambda x:x.replace('℃,','')) # 日次操作同理,这里不再赘述 data['日期'] = data['日期'].map(lambda x:x.replace('2020年05月0','')) data['日期'] = data['日期'].map(lambda x:x.replace('日','')) # 不理解的小伙伴可运行下两行代码查看运行结果(这里先注释掉了) # print(data['日期']) # print(data['最高气温'])
# 传入对应日期及其最高气温参数 # # 应以矩阵形式表达(对于单变量,矩阵就是列向量形式) xTrain = np.array([1,2,3,4,5,6,7,8,9])[:, np.newaxis] # 为方便理解,也转换成列向量 yTrain = np.array([33,35,28,20,26,27,23,22,22])
# 创建模型对象 model = LinearRegression() # 根据训练数据拟合出直线(以得到假设函数) hypothesis = model.fit(xTrain, yTrain) # 截距 print("theta0=", hypothesis.intercept_) # 斜率 print("theta1=", hypothesis.coef_)
# 预测2020年5月10日的最高气温 print("预测2020年5月10日的最高气温:", model.predict([[10]])) # 也可以批量预测多个日期的气温,注意要以列向量形式表达(有余数据集量少,故间隔时间长气温可能有较大差异) # 此处仅利用模型表示,不代表真实值(假设要预测10号、11号、12号的天气) xNew = np.array([0,10, 11, 12])[:, np.newaxis] yNew = model.predict(xNew) print("预测新数据:", xNew) print("预测结果:", yNew)
def initPlot(): # 先准备好一块画布 plt.figure() # 生成图表的名字 plt.title('2020年5月上旬大同天气') # 横坐标名字 plt.xlabel('日期') # 纵坐标名字 plt.ylabel('当日最高气温') # 表内有栅格(不想要栅格把此行注释掉即可) plt.grid(True) return plt
plt = initPlot() # 画图 # k是黑色,.是以点作为图上显示 plt.plot(xTrain, yTrain, 'k.') # 画出通过这些点的连续直线 plt.plot(xNew, yNew, 'g–') # 将图显示出来 plt.show()

模型评价:
拟合出来的判别函数效果如何:对训练数据的贴合度如何?对新数据的预测准确度如何?
可通过残差(residuals)和R方(r-squared)判断, 在Python中如何对单变量线性回归模型的效果进行评估
- 手动计算
假设hpyTrain代表针对训练数据的预测最高气温值,hpyTest代表针对测试数据的预测最高气温值- 训练数据残差平方和:ssResTrain = sum((hpyTrain – yTrain) ** 2)
- 测试数据残差平方和:ssResTest = sum((hpyTest – yTest) ** 2)
- 测试数据偏差平方和:ssTotTest = sum((yTest – np.mean(yTest)) ** 2)
- R方:Rsquare = 1 – ssResTest / ssTotTest
- LinearRegression对象提供的方法
- 训练数据残差平方和:model._residues
- R方:model.score(xTest, yTest)
import numpy as np import pandas as pd import matplotlib.pyplot as plt from sklearn.linear_model import LinearRegression # 解决中文问题(若没有此步骤,表名字及横纵坐标中的汉语将无法显示[具体会显示矩形小方格]) plt.rcParams['font.sans-serif'] = ['SimHei']
# 将数据从上一步存入的 .csv 格式文件中读取 data = pd.read_csv(r'F:\DaTong5Mouth.csv') # 由于最高气温与最低气温中有 / 分隔,故将其分开,即“气温”列由一列变为两列——“最高气温”和“最低气温” data['最高气温'] = data['气温'].str.split('/',expand=True)[0] # 我们要对数值进行分析,所以将多余的单位 ℃ 从列表中去掉,只保留数值部分 data['最高气温'] = data['最高气温'].map(lambda x:x.replace('℃,','')) # 日次操作同理,这里不再赘述 data['日期'] = data['日期'].map(lambda x:x.replace('2020年05月0','')) data['日期'] = data['日期'].map(lambda x:x.replace('日','')) # 不理解的小伙伴可运行下两行代码查看运行结果(这里先注释掉了) # print(data['日期']) # print(data['最高气温'])
# 传入对应日期及其最高气温参数 # # # 应以矩阵形式表达(对于单变量,矩阵就是列向量形式) # xTrain = np.array(data['日期'])[:, np.newaxis] # # 为方便理解,也转换成列向量 # yTrain = np.array(data['最高气温']) xTrain = np.array([1,2,3,4,5,6,7,8,9])[:, np.newaxis] # 训练数据(日期) yTrain = np.array([33,35,28,20,26,27,23,22,22]) # 训练数据(最高气温) xTest = np.array([3,6,9,10,11])[:,np.newaxis] # 测试数据(日期) yTest = np.array([28,27,22,20,19]) # 测试数据(最高气温) # 创建模型对象 model = LinearRegression() # 根据训练数据拟合出直线(以得到假设函数) hypothesis = model.fit(xTrain, yTrain) hpyTrain = model.predict(xTrain) # 针对测试数据进行预测 hpyTest = model.predict(xTest)
# 手动计算训练数据集残差 ssResTrain = sum((hpyTrain – yTrain) ** 2) print(ssResTrain) # Python计算的训练数据集残差 print(model._residues)
# 手动计算测试数据集残差 ssResTest = sum((hpyTest – yTest) ** 2) # 手动计算测试数据集y值偏差平方和 ssTotTest = sum((yTest – np.mean(yTest)) ** 2) # 手动计算R方 Rsquare = 1 – ssResTest / ssTotTest print(Rsquare) # Python计算的训练数据集的R方 print(model.score(xTest, yTest))
# corrcoef函数是在各行元素之间计算相关性,所以x和y都应是行向量 print(np.corrcoef(xTrain.T, yTrain.T)) # 计算训练数据的相关性 print(np.corrcoef(xTest.T, yTest.T)) # 计算测试数据的相关性
def initPlot(): # 先准备好一块画布 plt.figure() # 生成图表的名字 plt.title('2020年5月上旬大同天气') # 横坐标名字 plt.xlabel('日期') # 纵坐标名字 plt.ylabel('当日最高气温') # 表内有栅格(不想要栅格把此行注释掉即可) plt.grid(True) return plt
plt = initPlot() plt.plot(xTrain, yTrain, 'r.') # 训练点数据(红色) plt.plot(xTest, yTest, 'b.') # 测试点数据(蓝色) plt.plot(xTrain, hpyTrain, 'g-') # 假设函数直线(绿色) plt.show()
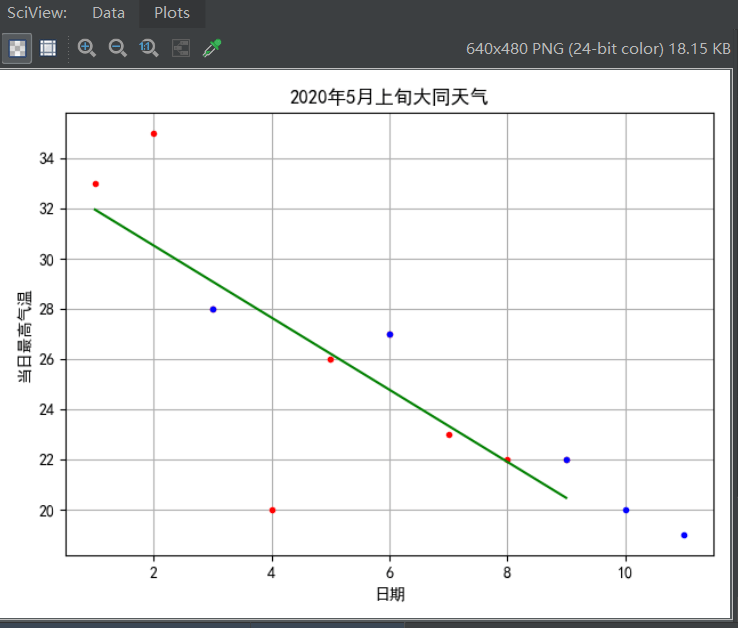

查看上述拟合效果:
- 红色为训练数据点,蓝色为测试数据点,绿色为判别函数(拟合直线)
- 计算出的R方为0.833,效果良
- 计算出训练数据的相关性为-0.763,测试数据的相关性为-0.968。可以发现,根据数据集的不同,日期与最高气温之间的相关性波动较大。这也能解释为何针对测试数据的R方事实上不够理想
3.2 多变量线性回归
在单变量线性回归中,最高气温仅与日期有关(尝试可知,这显然是极不合理的),按照这一假设,其预测的结果并不令人满意(R方=0.833)。因此在多变线性回归模型中再引入一个新的影响因素:最低气温(此处要注意和最高气温一样,计算前先利用 .map 方法将 ℃ 置空,仅将最低气温调整成数值,以便能够进行数值计算)
模型二:基于LinearRegression实现的多变量线性回归模型
- 与单变量线性回归类似,但要注意训练数据此时是(是训练数据条数,是自变量个数)
- 针对测试数据的预测结果,其R方约为0.466,这时我们发现还没有单变量量线性回归R方值大,说明拟合效果差于单变量线性回归。这是什么问题呢?经过思考,我认为最高气温的影响因素不能拿日期和最低气温来衡量,也就是说,最高气温的走势依据情况特殊而复杂,不能单靠日期和最低气温等片面的为数不多的方面来进行拟合。
import numpy as np import pandas as pd import matplotlib.pyplot as plt from sklearn.linear_model import LinearRegression # 解决中文问题(若没有此步骤,表名字及横纵坐标中的汉语将无法显示[具体会显示矩形小方格]) plt.rcParams['font.sans-serif'] = ['SimHei']
# 将数据从上一步存入的 .csv 格式文件中读取 data = pd.read_csv(r'F:\DaTong5Mouth.csv') # 由于最高气温与最低气温中有 / 分隔,故将其分开,即“气温”列由一列变为两列——“最高气温”和“最低气温” data['最高气温'] = data['气温'].str.split('/',expand=True)[0] # 我们要对数值进行分析,所以将多余的单位 ℃ 从列表中去掉,只保留数值部分 data['最高气温'] = data['最高气温'].map(lambda x:x.replace('℃,','')) data['最低气温'] = data['气温'].str.split('/',expand=True)[1] # 我们要对数值进行分析,所以将多余的单位 ℃ 从列表中去掉,只保留数值部分 data['最低气温'] = data['最低气温'].map(lambda x:x.replace('℃,','')) # 日次操作同理,这里不再赘述 data['日期'] = data['日期'].map(lambda x:x.replace('2020年05月0','')) data['日期'] = data['日期'].map(lambda x:x.replace('日','')) # 不理解的小伙伴可运行下两行代码查看运行结果(这里先注释掉了) # print(data['日期']) # print(data['最高气温']) # print(data['最低气温'])
# 传入对应日期及其最高气温参数 # # # 应以矩阵形式表达(对于单变量,矩阵就是列向量形式) # xTrain = np.array(data['日期'])[:, np.newaxis] # # 为方便理解,也转换成列向量 # yTrain = np.array(data['最高气温']) # 训练集 xTrain = np.array([1, 2, 3, 4, 5, 6, 7, 8, 9]) # 无需手动添加Intercept Item项 yTrain = np.array([[33, 8], [35, 9], [28, 4], [20, 4], [26, 6], [27,10], [23,10], [22,7], [22,3]]) # 测试集 xTest = np.array([3, 6, 9, 10, 11]) yTest = np.array([[28, 4], [27, 10], [22, 3], [20, 5], [19, 7]])
# 创建模型对象 model = LinearRegression() # 根据训练数据拟合出直线(以得到假设函数) model.fit(yTrain, xTrain) # 针对测试数据进行预测 hpyTest = model.predict(yTest)
print("假设函数参数:", model.intercept_, model.coef_) print("测试数据预测结果与实际结果差异:", hpyTest – xTest) print("测试数据R方:", model.score(yTest, xTest))

模型三:基于成本函数和梯度下降实现的多变量线性回归模型
- 经过模型三的拟合,我们发现R方仅为0.164,还不如模型二的预测结果呢。而根据理论知识我们知道,这个模型预测结果应该是线性回归模型中预测拟合效果较好的一种,低的这个R方值经过思考,可进一步说明最高气温的影响因素不仅仅取决于日期和最低气温,甚至我们可推断出可能与日期及最低气温值等影响因素无关。
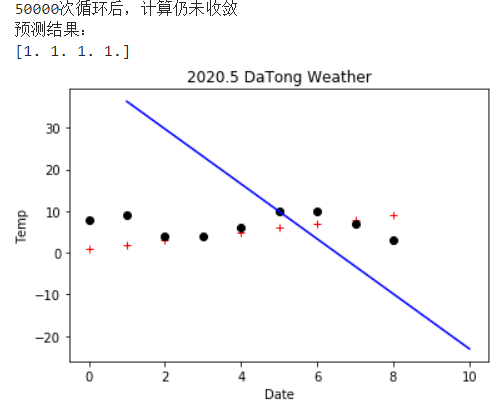
- 通过运行结果发现“50000次循环后,计算仍未收敛”。这说明①在未对自变量归一化处理的情况下,运算出现异常,无法收敛;②设置了过大的学习速率,会导致计算不收敛。
import numpy as np import pandas as pd import matplotlib.pyplot as plt import bgd_resolver from sklearn.linear_model import LinearRegression # 解决中文问题(若没有此步骤,表名字及横纵坐标中的汉语将无法显示[具体会显示矩形小方格]) plt.rcParams['font.sans-serif'] = ['SimHei']
def costFn(theta, X, y): # 成本函数 temp = X.dot(theta) – y return (temp.T.dot(temp)) / (2 * len(X))
def gradientFn(theta, X, y): # 根据成本函数,分别对x0,x1…xn求导数(梯度) return (X.T).dot(X.dot(theta) – y) / len(X)
# 将数据从上一步存入的 .csv 格式文件中读取 data = pd.read_csv(r'F:\DaTong5Mouth.csv') # 由于最高气温与最低气温中有 / 分隔,故将其分开,即“气温”列由一列变为两列——“最高气温”和“最低气温” data['最高气温'] = data['气温'].str.split('/',expand=True)[0] # 我们要对数值进行分析,所以将多余的单位 ℃ 从列表中去掉,只保留数值部分 data['最高气温'] = data['最高气温'].map(lambda x:x.replace('℃,','')) data['最低气温'] = data['气温'].str.split('/',expand=True)[1] # 我们要对数值进行分析,所以将多余的单位 ℃ 从列表中去掉,只保留数值部分 data['最低气温'] = data['最低气温'].map(lambda x:x.replace('℃,','')) # 日次操作同理,这里不再赘述 data['日期'] = data['日期'].map(lambda x:x.replace('2020年05月0','')) data['日期'] = data['日期'].map(lambda x:x.replace('日','')) # 不理解的小伙伴可运行下两行代码查看运行结果(这里先注释掉了) # print(data['日期']) # print(data['最高气温']) # print(data['最低气温'])
# 传入对应日期及其最高气温参数 # # # 应以矩阵形式表达(对于单变量,矩阵就是列向量形式) # xTrain = np.array(data['日期'])[:, np.newaxis] # # 为方便理解,也转换成列向量 # yTrain = np.array(data['最高气温']) # 训练集 xTrain = np.array([1, 2, 3, 4, 5, 6, 7, 8, 9]) # 无需手动添加Intercept Item项 yTrainData = np.array([[33, 8], [35, 9], [28, 4], [20, 4], [26, 6], [27,10], [23,10], [22,7], [22,3]]) yTrain = np.c_[yTrainData, np.ones(len(yTrainData))] np.random.seed(0) init_theta = np.random.randn(yTrain.shape[1]) theta = bgd_resolver.batch_gradient_descent(costFn, gradientFn, init_theta, yTrain, xTrain) print("theta值", theta) # 测试集 xTest = np.array([3, 6, 9, 10, 11]) yTestData = np.array([[28, 4], [27, 10], [22, 3], [20, 5], [19, 7]]) yTest = np.c_[yTestData, np.ones(len(yTestData))] print("测试数据预测值与真实值的差异:", xTest.dot(theta) – xTest)
rsquare = bgd_resolver.batch_gradient_descent_rsquare(theta, yTest, xTest) print("测试数据R方:", rsquare)

3.3 以"线性回归"的方式来拟合高阶曲线
这一部分我们分别使用一阶曲线(直线)、二阶曲线和三阶曲线进行拟合,并检查拟合效果。
在拟合数据点时,一般来说,对于一个自变量的,拟合出来是一条直线;对于两个自变量的,拟合出来时一个直平面。这种拟合结果是严格意义上的“线性”回归。但是有时候,采用“曲线”或“曲面”的方式来拟合,能够对训练数据产生更逼近的效果。这就是“高阶拟合”。
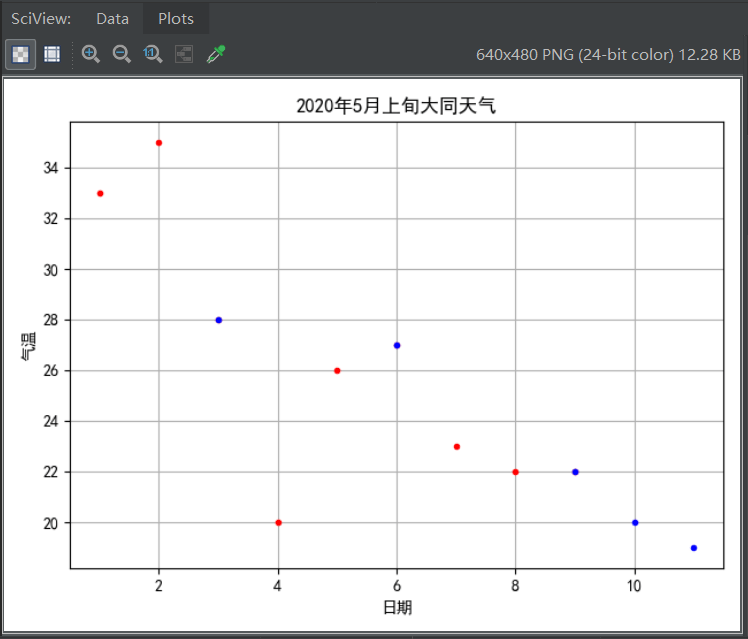
首先,我们查看要拟合的数据
import numpy as np import matplotlib.pyplot as plt # 解决中文问题(若没有此步骤,表名字及横纵坐标中的汉语将无法显示[具体会显示矩形小方格]) plt.rcParams['font.sans-serif'] = ['SimHei']
xTrain = np.array([1,2,3,4,5,6,7,8,9])[:, np.newaxis] # 训练数据(日期) yTrain = np.array([33,35,28,20,26,27,23,22,22]) # 训练数据(最高气温) xTest = np.array([3,6,9,10,11])[:,np.newaxis] # 测试数据(日期) yTest = np.array([28,27,22,20,19]) # 测试数据(最高气温) plotData = np.array(np.linspace(0, 15, 30))[:,np.newaxis] # 作图用的数据点
def initPlot(): plt.figure() plt.title('2020年5月上旬大同天气') plt.xlabel('日期') plt.ylabel('气温') plt.grid(True) return plt
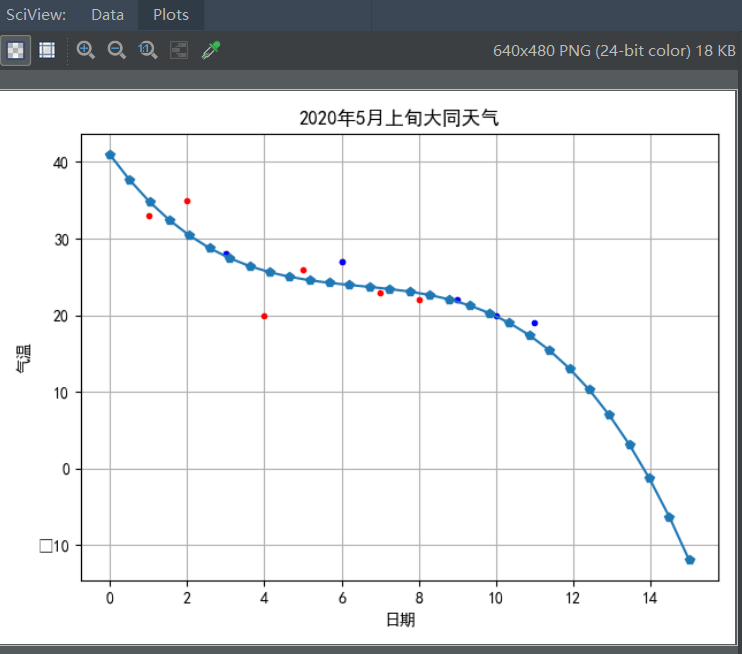
plt = initPlot() plt.plot(xTrain, yTrain, 'r.') # 训练点数据(红色) plt.plot(xTest, yTest, 'b.') # 测试点数据(蓝色) plt.show()
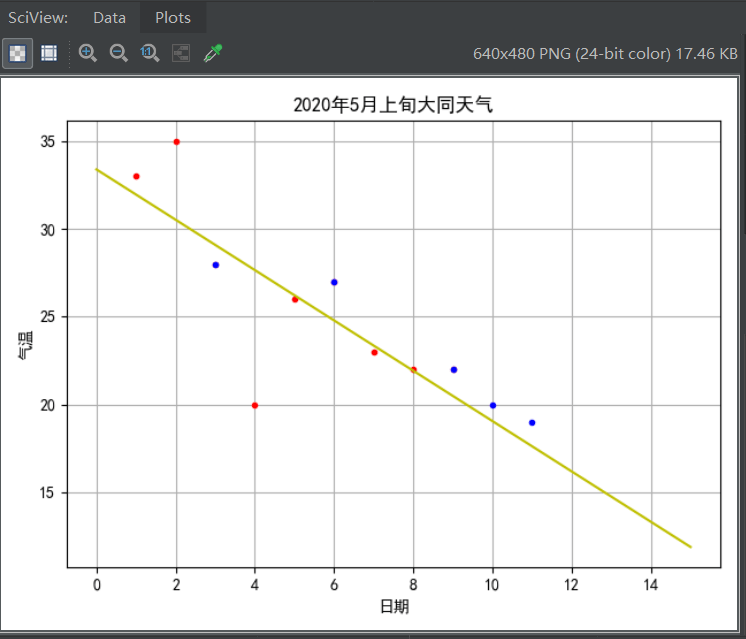
模型四:一阶线性拟合
from sklearn.linear_model import LinearRegression
# 线性拟合 linearModel = LinearRegression() linearModel.fit(xTrain, yTrain) linearModelTrainResult = linearModel.predict(plotData)
# 计算R方 linearModelRSquare = linearModel.score(xTest, yTest)
print("线性拟合R方:", linearModelRSquare)
plt = initPlot() plt.plot(xTrain, yTrain, 'r.') # 训练点数据(红色) plt.plot(xTest, yTest, 'b.') # 测试点数据(蓝色) plt.plot(plotData, linearModelTrainResult, 'y-') # 线性拟合线 plt.show()

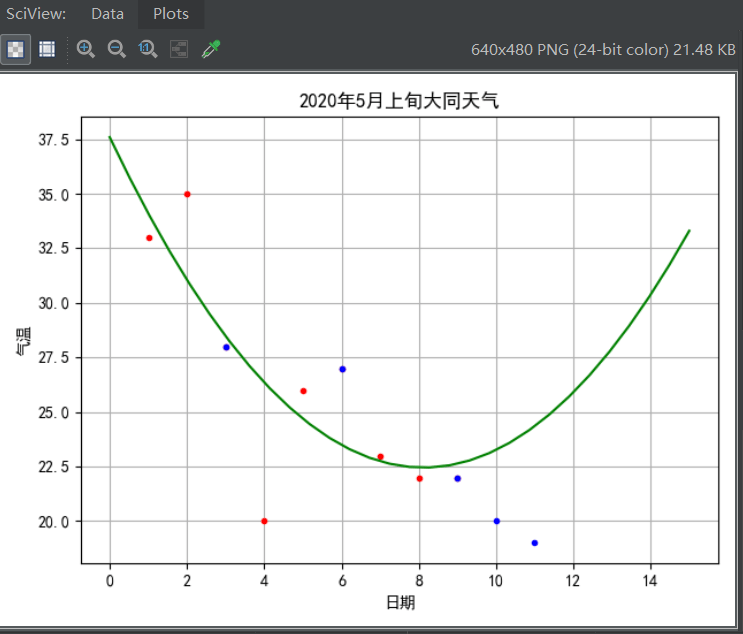
模型五:二阶曲线拟合
- PolynomialFeatures.fit_transform提供了将1阶数据扩展到高阶数据的方法
- 训练样本和测试样本都需要进行扩充
from sklearn.preprocessing import PolynomialFeatures from sklearn.linear_model import LinearRegression
# 二阶曲线拟合 theta0 + theta1*x + theta2*x*x x*x => z theta0+theta1*x+theta2*z quadratic_featurizer = PolynomialFeatures(degree=2) xTrain_quadratic = quadratic_featurizer.fit_transform(xTrain) print(xTrain_quadratic) # 查看扩展后的特征矩阵 quadraticModel = LinearRegression() quadraticModel.fit(xTrain_quadratic, yTrain)
# 计算R方(针对测试数据) xTest_quadratic = quadratic_featurizer.fit_transform(xTest) quadraticModelRSquare = quadraticModel.score(xTest_quadratic, yTest) print("二阶拟合R方:", quadraticModelRSquare)
# 绘图点也同样需要进行高阶扩充以便使用曲线进行拟合 plotData_quadratic = quadratic_featurizer.fit_transform(plotData) quadraticModelTrainResult = quadraticModel.predict(plotData_quadratic)
plt = initPlot() plt.plot(xTrain, yTrain, 'r.') # 训练点数据(红色) plt.plot(xTest, yTest, 'b.') # 测试点数据(蓝色) plt.plot(plotData, quadraticModelTrainResult, 'g-') # 二阶拟合线 plt.show()

模型六:三阶曲线拟合
from sklearn.preprocessing import PolynomialFeatures from sklearn.linear_model import LinearRegression # 三阶曲线拟合 cubic_featurizer = PolynomialFeatures(degree=3) xTrain_cubic = cubic_featurizer.fit_transform(xTrain) cubicModel = LinearRegression() cubicModel.fit(xTrain_cubic, yTrain) plotData_cubic = cubic_featurizer.fit_transform(plotData) cubicModelTrainResult = cubicModel.predict(plotData_cubic)
# 计算R方(针对测试数据) xTest_cubic = cubic_featurizer.fit_transform(xTest) cubicModelRSquare = cubicModel.score(xTest_cubic, yTest) print("三阶拟合R方:", cubicModelRSquare)
plt = initPlot() plt.plot(xTrain, yTrain, 'r.') # 训练点数据(红色) plt.plot(xTest, yTest, 'b.') # 测试点数据(蓝色) plt.plot(plotData, cubicModelTrainResult, 'p-') # 三阶拟合线 plt.show()

综上对比我们发现,一阶拟合R方约为0.833,二阶拟合R方约为0.218,三阶拟合R方约为0.800。很显然,得到的拟合R方值并不是随着阶数的增高而增大,同前理,说明日期和最低气温并不是最高气温的影响因素。这正与我们常识所知的结论相吻合。因此,想要预测天气值就错综而复杂,不得片面考虑一个或为数不多的几个因素,且不应考虑到与气温影响因素无关的影响变量:比如说像上例中所提及的日期、最低气温等。
3.4 线性回归预测天气
模型七:线性回归预测模型
使用sklearn.linear_model.LinearRegression处理
无需对自变量进行归一化处理,也能得到一致的结果。针对训练数据的R方约为0.583
1:装载并查看数据信息
import numpy as np
xTrain = np.array([1,2,3,4,5,6,7,8,9])[:, np.newaxis] # 训练数据(日期) yTrain = np.array([33,35,28,20,26,27,23,22,22]) # 训练数据(最高气温)
# 查看天气统计数据 print("天气数据统计:") print("最低:%.2f, 最高:%.2f, 平均:%.2f, 中位数:%.2f, 标准差:%.2f" % (np.min(yTrain), np.max(yTrain), np.mean(yTrain), np.median(yTrain) ,np.std(yTrain)))
2:使用LinearRegression,没有进行归一化预处理
''' 使用LinearRegression,没有进行归一化预处理 '''
import numpy as np from sklearn.linear_model import LinearRegression
train_data = np.array([1,2,3,4,5,6,7,8,9])[:, np.newaxis] # 训练数据(日期) train_temp = np.array([33,35,28,20,26,27,23,22,22])[:, np.newaxis] # 训练数据(最高气温) xTrain = np.array(train_data[:, 0:2]) yTrain = np.array(train_temp[:, -1])
xTrain = np.c_[xTrain, np.ones(len(xTrain))]
model = LinearRegression() model.fit(xTrain, yTrain) print("LinearRegression计算R方:", model.score(xTrain, yTrain))

3:使用LinearRegression,进行归一化预处理
''' 使用LinearRegression,进行归一化预处理 '''
import numpy as np from sklearn.linear_model import LinearRegression
def normalizeData(X): # 每列(每个Feature)分别求出均值和标准差,然后与X的每个元素分别进行操作 return (X – X.mean(axis=0))/X.std(axis=0)
train_data = np.array([1,2,3,4,5,6,7,8,9])[:, np.newaxis] # 训练数据(日期) train_temp = np.array([33,35,28,20,26,27,23,22,22])[:, np.newaxis] # 训练数据(最高气温)
xTrain = np.array(train_data[:, 0:2]) yTrain = np.array(train_temp[:, -1]) xTrain = normalizeData(xTrain)
xTrain = np.c_[xTrain, np.ones(len(xTrain))] # 归一化完成后再添加intercept item列
model = LinearRegression() model.fit(xTrain, yTrain) print("LinearRegression计算R方:", model.score(xTrain, yTrain))

使用自定义的批量梯度下降法
- 在未对自变量归一化处理的情况下,运算可能出现异常,无法收敛,但这里没有出现
- 归一化处理后,能够得到与LinearRegression类似的结果,即R方值约为0.582
- 因此,不考虑影响因素合不合理情况下这种预测结果实质上准确率不容乐观
1:使用自定义BGD,未作归一化处理(可能无法收敛,但这里没有出现无法收敛情况)
''' 使用自定义BGD,未作归一化处理,可能无法收敛 '''
import numpy as np import bgd_resolver
def costFn(theta, X, y): temp = X.dot(theta) – y return (temp.T.dot(temp)) / (2 * len(X))
def gradientFn(theta, X, y): return (X.T).dot(X.dot(theta) – y) / len(X)
train_date = np.array([1,2,3,4,5,6,7,8,9])[:, np.newaxis] # 训练数据(日期) train_temp = np.array([33,35,28,20,26,27,23,22,22])[:, np.newaxis] # 训练数据(最高气温) xTrain = np.array(train_date[:, 0:2]) yTrain = np.array(train_temp[:, -1])
xTrain = np.c_[xTrain, np.ones(len(xTrain))]
init_theta = np.random.randn(xTrain.shape[1]) # 如果数据不进行Normalize,则下面的梯度算法有可能不收敛 theta = bgd_resolver.batch_gradient_descent(costFn, gradientFn, init_theta, xTrain, yTrain) rsquare = bgd_resolver.batch_gradient_descent_rsquare(theta, xTrain, yTrain) print("梯度下降法计算R方:", rsquare)

2:使用自定义BGD,作归一化处理
''' 使用自定义BGD,作归一化处理 '''
import numpy as np import bgd_resolver
def normalizeData(X): # 每列(每个Feature)分别求出均值和标准差,然后与X的每个元素分别进行操作 return (X – X.mean(axis=0))/X.std(axis=0)
def costFn(theta, X, y): temp = X.dot(theta) – y return (temp.T.dot(temp)) / (2 * len(X))
def gradientFn(theta, X, y): return (X.T).dot(X.dot(theta) – y) / len(X)
train_date = np.array([1,2,3,4,5,6,7,8,9])[:, np.newaxis] # 训练数据(日期) train_temp = np.array([33,35,28,20,26,27,23,22,22])[:, np.newaxis] # 训练数据(最高气温) xTrain = np.array(train_date[:, 0:2]) yTrain = np.array(train_temp[:, -1])
xTrain = np.c_[xTrain, np.ones(len(xTrain))]
init_theta = np.random.randn(xTrain.shape[1]) # 如果数据不进行Normalize,则下面的梯度算法有可能不收敛 theta = bgd_resolver.batch_gradient_descent(costFn, gradientFn, init_theta, xTrain, yTrain) rsquare = bgd_resolver.batch_gradient_descent_rsquare(theta, xTrain, yTrain) print("梯度下降法计算R方:", rsquare)
![]()
3.5 线性回归的其它计算方法
模型八:基于协方差-方差公式实现的线性回归模型
事实上,使用该方法计算出来的判别函数参数,与LinearRegression对象的计算结果一致。
''' 使用协方差-方差公式计算线性回归权重参数,并与LinearRegression结果对比 '''
import numpy as np from sklearn.linear_model import LinearRegression
xTrain = np.array([1,2,3,4,5,6,7,8,9])[:, np.newaxis] # 训练数据(日期) yTrain = np.array([33,35,28,20,26,27,23,22,22]) # 训练数据(最高气温)
model = LinearRegression() hypothesis = model.fit(xTrain, yTrain) print("LinearRegression theta1=", hypothesis.coef_) print("LinearRegression theta0=", hypothesis.intercept_)
# cov函数是在各行元素之间计算协方差,所以x和y都应是行向量 theta1 = np.cov(xTrain.T, yTrain, ddof=1)[1,0] / np.var(xTrain, ddof=1) theta0 = np.mean(yTrain) – theta1 * np.mean(xTrain) print("Least Square theta1=", theta1) # 通过最小二乘法公式计算的斜率 print("Least Square theta0=", theta0) # 通过最小二乘法公式计算的截距

模型九:基于成本函数和批量梯度下降算法实现的线性回归模型
成本函数:
- 在使用训练数据来训练模型时,用于定义判别函数与实际值的误差。成本函数计算结果越小,说明该模型与训练数据的匹配程度越高
- 设定了某个模型后,只要给定了成本函数,就可以使用数值方法求出成本函数的最优解(极小值),从而确定判别函数模型中各个系数
梯度下降:
- 梯度下降是迭代法的一种,可以用于求解最小二乘问题(线性和非线性都可以)。在求解机器学习算法的模型参数,即无约束优化问题时
''' 使用批量梯度下降算法优化线性回归权重参数 '''
import numpy as np import matplotlib.pyplot as plt import bgd_resolver # 来自bgd_resolver.py文件
def costFn(theta, X, y): # 定义线性回归的成本函数 temp = X.dot(theta) – y return temp.dot(temp) / (2*len(X))
def gradientFn(theta, X, y): # 根据成本函数,分别对x0和x1求导数(梯度) return (X.T).dot(X.dot(theta) – y) / len(X)
xTrain = np.array([1,2,3,4,5,6,7,8,9])[:, np.newaxis] # 训练数据(日期) yTrain = np.array([33,35,28,20,26,27,23,22,22]) # 训练数据(最高气温) xTrain_ext = np.c_[np.ones(len(xTrain)), xTrain] # 第一列补充0。注意返回的第一个权重参数将对应theta0
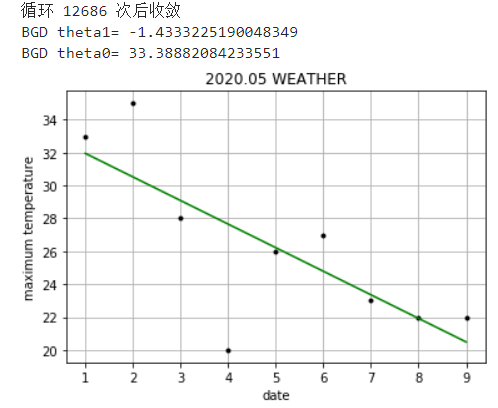
np.random.seed(0) theta_init = np.random.randn(xTrain_ext.shape[1]) theta = bgd_resolver.batch_gradient_descent(costFn, gradientFn, theta_init, xTrain_ext, yTrain, learning_rate=0.005, tolerance=1e-12) print("BGD theta1=", theta[1]) print("BGD theta0=", theta[0])
def initPlot(): plt.figure() plt.title('2020.05 WEATHER') plt.xlabel('date') plt.ylabel('maximum temperature') plt.grid(True) return plt
plt = initPlot() plt.plot(xTrain, yTrain, 'k.') plt.plot(xTrain, xTrain_ext.dot(theta), 'g-') plt.show()
模型十:基于SGDRegressor随机梯度下降算法的实现
sklearn.linear_model.SGDRegressor对象提供了使用随机梯度下降算法进行线性回归的实现
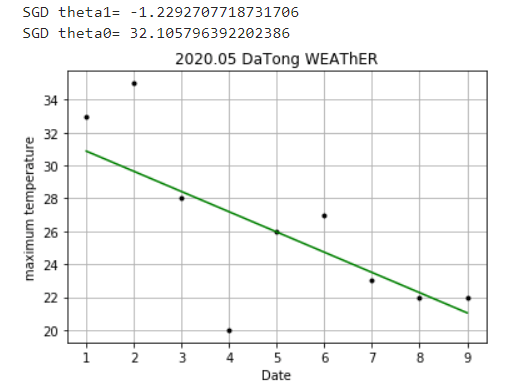
- 但是SGDRegressor对于数据集较大的情形比较合适,如果样本较少(例如本例),其效果一般不好
- 可以观察到,每次运行时,其优化结果并不相同
''' 使用SGDRegressor随机梯度下降算法优化线性回归权重参数 '''
%matplotlib inline import numpy as np import matplotlib.pyplot as plt from sklearn.linear_model import SGDRegressor
xTrain = np.array([1,2,3,4,5,6,7,8,9])[:, np.newaxis] # 训练数据(日期) yTrain = np.array([33,35,28,20,26,27,23,22,22]) # 训练数据(最高气温)
regressor = SGDRegressor(loss='squared_loss', max_iter=2000) regressor.fit(xTrain, yTrain) # 每次运行,得到的结果并不相同 theta0 = regressor.intercept_[0] theta1 = regressor.coef_[0] print("SGD theta1=", theta1) print("SGD theta0=", theta0)
def initPlot(): plt.figure() plt.title('2020.05 DaTong WEAThER') plt.xlabel('Date') plt.ylabel('maximum temperature') plt.grid(True) return plt
plt = initPlot() plt.plot(xTrain, yTrain, 'k.') plt.plot(xTrain, theta0 + theta1 * xTrain, 'g-') plt.show()
3.6 对数几率回归
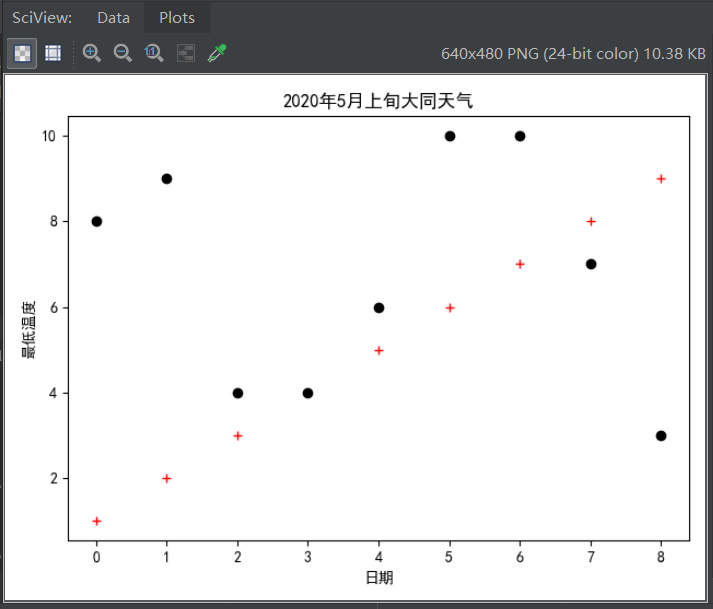
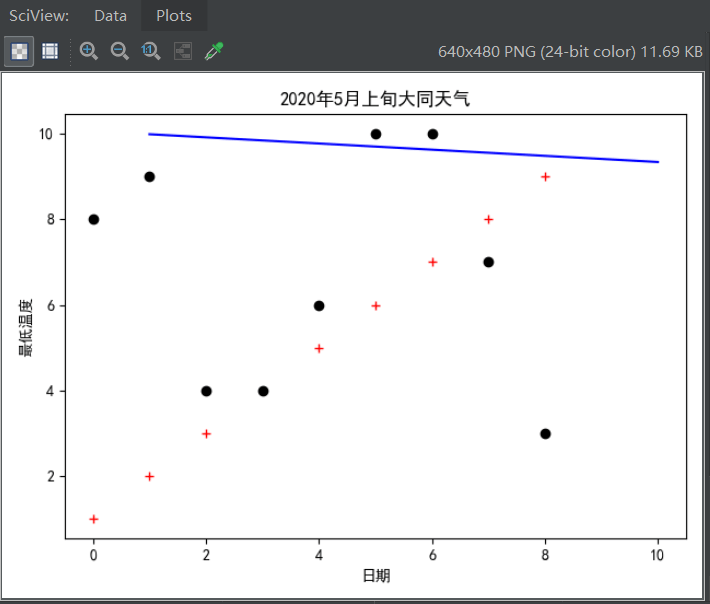
查看数据图像
其中最高气温影响因素日期用 + 表示,最低气温用 · 表示。
import numpy as np import matplotlib.pyplot as plt # 解决中文问题 plt.rcParams['font.sans-serif'] = ['SimHei']
def initPlot(): plt.figure() plt.title('2020年5月上旬大同天气') plt.xlabel('日期') plt.ylabel('最低温度') return plt
plt = initPlot() factor1 = np.array([1,2,3,4,5,6,7,8,9]) # 从trainData中获取下标索引第2列(passed)值为1的所有行的第0列元素 factor2 = np.array([8,9,4,4,6,10,10,7,3]) plt.plot(factor1,'r+') plt.plot(factor2,'ko') plt.show()
模型十一:使用LogisticRegression进行逻辑回归模型
- 设置逻辑回归算法的某些属性
model = LogisticRegression(solver='lbfgs')
使用lbfgs算法来执行回归计算。默认使用liblinear。注意,这两种算法的结果并不相同 - 执行计算
model.fit(X, y) - 执行预测
model.predict(newX)
返回值是newX矩阵中每行数据所对应的结果。如果是1,则表示passed;如果是0,则表示unpassed - 获得模型参数值
theta0 = model.intercept_[0] theta1 = model.coef_[0,0] theta2 = model.coef_[0,1] - 决策边界线
- 决策边界线可视为两种类别数据点的分界线。在该分界线的一侧,所有数据点都被归为passed类(1),另一侧的所有数据点都被归为unpassed类(0)
- 对于本例来说,决策边界线是一条直线(在案例2中进行了说明)
''' 使用LogisticRegression进行逻辑回归 '''
import numpy as np import matplotlib.pyplot as plt from sklearn.linear_model import LogisticRegression # 解决中文问题 plt.rcParams['font.sans-serif'] = ['SimHei']
xTrain = np.array([[1,8],[2,9],[3,4],[4,6],[5,10],[6,10],[7,10],[8,7],[9,3]]) yTrain = np.array([33,35,28,20,26,27,23,22,22]) # print(xTrain)
model = LogisticRegression(solver='lbfgs') # 使用lbfgs算法。默认是liblinear算法 model.fit(xTrain, yTrain) newFactors = np.array([[2, 9],[5, 10],[9, 3],[10, 5]]) print("预测结果:") print(model.predict(newFactors)) # 获取theta计算结果 theta = np.array([model.intercept_[0], model.coef_[0,0], model.coef_[0,1]])
def initPlot(): plt.figure() plt.title('2020年5月上旬大同天气') plt.xlabel('日期') plt.ylabel('最低温度') return plt
plt = initPlot() factor1 = np.array([1,2,3,4,5,6,7,8,9]) # 影响因素1:日期 factor2 = np.array([8,9,4,4,6,10,10,7,3]) # 影响因素2:最低气温 plt.plot(factor1,'r+') plt.plot(factor2,'ko') boundaryX = np.array([1,2,3,4,5,6,7,8,9,10]) # 绘制决策边界线(每天日期) boundaryY = -(theta[1] * boundaryX + theta[0]) / theta[2] # 根据决策边界线的直线公式和x值,计算对应的y值 plt.plot(boundaryX, boundaryY, 'b-') plt.show()

模型十二:基于成本函数和梯度下降算法进行逻辑回归模型
''' 使用梯度下降算法进行逻辑回归 '''
import numpy as np import matplotlib.pyplot as plt import bgd_resolver
def normalizeData(X, column_mean, column_std): return (X – column_mean) / column_std
def sigmoid(z): return 1. / (1 + np.exp(-z))
def costFn(theta, X, y): temp = sigmoid(X.dot(theta)) cost = -y.dot(np.log(temp)) – (1 – y).dot(np.log(1 – temp)) return cost / len(X)
def gradientFn(theta, X, y): return xTrain.T.dot(sigmoid(xTrain.dot(theta)) – yTrain) / len(X)
def initPlot(): plt.figure() plt.title('2020.5 DaTong Weather') plt.xlabel('Date') plt.ylabel('Temp') return plt
xTrain = np.array([[1,8],[2,9],[3,4],[4,6],[5,10],[6,10],[7,10],[8,7],[9,3]]) # 计算训练数据每列平均值和每列的标准差 xTrain_column_mean = xTrain.mean(axis=0) xTrain_column_std = xTrain.std(axis=0) xTrain = normalizeData(xTrain, xTrain_column_mean, xTrain_column_std) # 如果不进行归一化处理,计算过程中可能产生溢出(但似乎仍可以收敛) x0 = np.ones(len(xTrain)) xTrain = np.c_[x0, xTrain] # 需手动追加Intercept Item列 yTrain = np.array([33,35,28,20,26,27,23,22,22])
np.random.seed(0) init_theta = np.random.random(3) # 随机初始化theta theta = bgd_resolver.batch_gradient_descent(costFn, gradientFn, init_theta, xTrain, yTrain, 0.005, 0.00001)
# 预测若干数据,也需要先归一化,使用之前训练数据的mean和std newFactors = np.array([[2, 9],[5, 10],[9, 3],[10, 5]]) newFactors = normalizeData(newScores, xTrain_column_mean, xTrain_column_std) x0 = np.ones(len(newFactors)) newFactors = np.c_[x0, newFactors] print("预测结果:") print(sigmoid(newFactors.dot(theta)))
plt = initPlot() factor1 = np.array([1,2,3,4,5,6,7,8,9]) # 影响因素1:日期 factor2 = np.array([8,9,4,4,6,10,10,7,3]) # 影响因素2:最低气温 plt.plot(factor1,'r+') plt.plot(factor2,'ko')
# 绘制决策边界线 boundaryX = np.array([1,2,3,4,5,6,7,8,9,10]) # 因为之前进行了归一化,因此边界线上点的x坐标也需要先归一化。x坐标对应的列索引是0 normalizedBoundaryX = (boundaryX – xTrain_column_mean[0]) / xTrain_column_std[0] # 下面计算出来的边界线上的y坐标normalizedBoundaryY是经过归一化处理的坐标 normalizedBoundaryY = (theta[0] * normalizedBoundaryX + theta[1] ) / theta[1] # boundaryY才是将归一化坐标还原成正常坐标。y坐标对应的列索引是1 boundaryY = xTrain_column_std[1] * normalizedBoundaryY + xTrain_column_mean[1]
plt.plot(boundaryX, boundaryY, 'b-') plt.show()
模型十三:基于scipy.optimize优化运算库实现对数几率回归模型
- 使用minimize库函数
- 需要提供jac参数,并将其设置为梯度计算函数
- scipy.optimize库中提供的算法会比我们自己实现的算法更高效、灵活、全面
- 本例中没有对数据进行归一处理,因此导致minimize方法执行过程中溢出(尽管可能也能收敛)。请自行添加归一化处理功能
''' 使用minimize来优化逻辑回归求解 '''
import numpy as np import matplotlib.pyplot as plt import scipy.optimize as opt
# 定义全局变量 xTrain = np.array([[1,8],[2,9],[3,4],[4,6],[5,10],[6,10],[7,10],[8,7],[9,3]]) x0 = np.ones(len(xTrain)) xTrain = np.c_[x0, xTrain] yTrain = np.array([33,35,28,20,26,27,23,22,22])
def sigmoid(z): return 1. / (1 + np.exp(-z))
# Cost Function以theta为参数 def costFn(theta, X, y): temp = sigmoid(xTrain.dot(theta)) cost = -yTrain.dot(np.log(temp)) – (1 – yTrain).dot(np.log(1 – temp)) return cost / len(X)
# Gradient Function以theta为参数 def gradientFn(theta, X, y): return xTrain.T.dot(sigmoid(xTrain.dot(theta)) – yTrain) / len(X)
np.random.seed(0) # 随机初始化theta,计算过程中可能产生溢出。 # 可以尝试将init_theta乘以0.01,这样可以防止计算溢出 init_theta = np.random.random(xTrain.shape[1]) result = opt.minimize(costFn, init_theta, args=(xTrain, yTrain), method='BFGS', jac=gradientFn, options={'disp': True}) theta = result.x # 最小化Cost时的theta
def initPlot(): plt.figure() plt.title('2020.5 DaTong Weather') plt.xlabel('Date') plt.ylabel('Temp') return plt
plt = initPlot() factor1 = np.array([1,2,3,4,5,6,7,8,9]) # 影响因素1:日期 factor2 = np.array([8,9,4,4,6,10,10,7,3]) # 影响因素2:最低气温 plt.plot(factor1,'r+') plt.plot(factor2,'ko') boundaryX = np.array([1,2,3,4,5,6,7,8,9,10]) # 绘制决策边界线 boundaryY = (theta[1] * boundaryX + theta[0]) / theta[2] plt.plot(boundaryX,boundaryY, 'b-') plt.show()
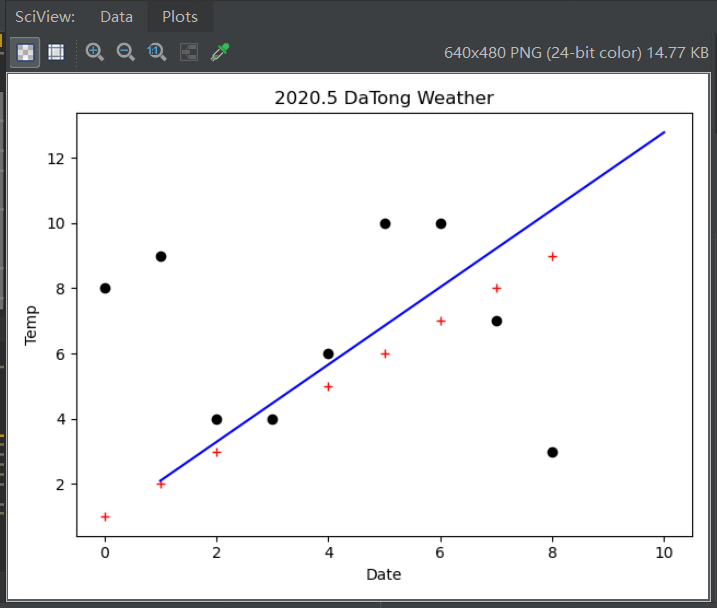
综上可以观察到,所有数据点并不明显分成两个类别。
线性回归主要都是针对训练数据和计算结果均为数值的情形。而在本例中,结果不是数值而是某种分类:这里分成日期和最低气温两类。而且发现,两类并不显示有明显的分界线。这进一步说明最高气温的影响因素不是日期和最低气温。
4 总结
我们通过数据爬取并用十三种预测模型最终得出结论:最高气温的影响因素与日期和最低气温毫无关联(由上可知会出现很荒谬的、与理论不符的结论,进而判断);而这一结论与我们常识正好相符合,也就说明在此方面,实验成功!
5 声明
转载请注明原文链接
感谢阅读!
由于博主初学这部分知识,难免有疏漏错误之处,敬请读者批评指正!
END
神龙|纯净稳定代理IP免费测试>>>>>>>>天启|企业级代理IP免费测试>>>>>>>>IPIPGO|全球住宅代理IP免费测试


